
Electricity Markets
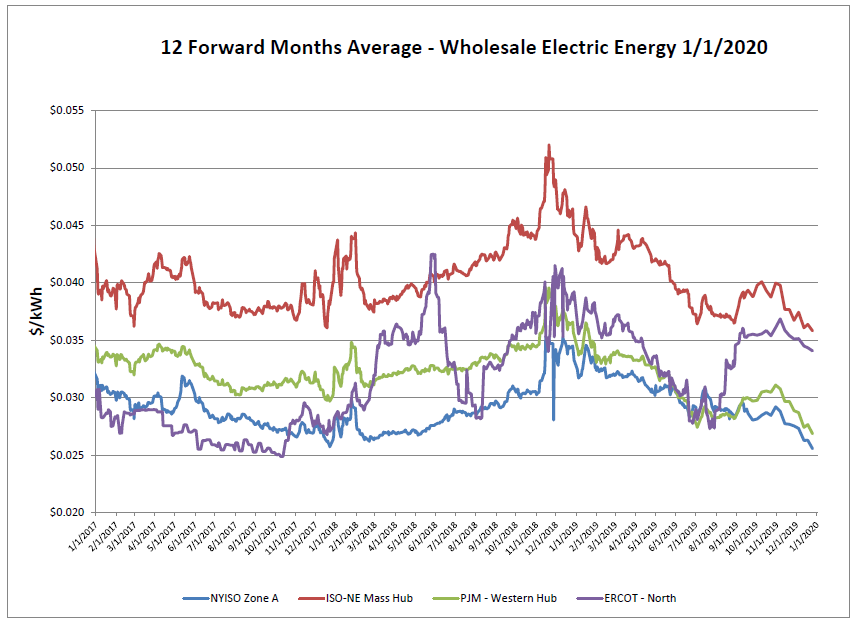
Electric markets continue to trend down and are now reminiscent of pre-2017 levels. Mild winter weather has kept the underlying cost of natural gas low and volatility isolated to short spikes in the daily markets.
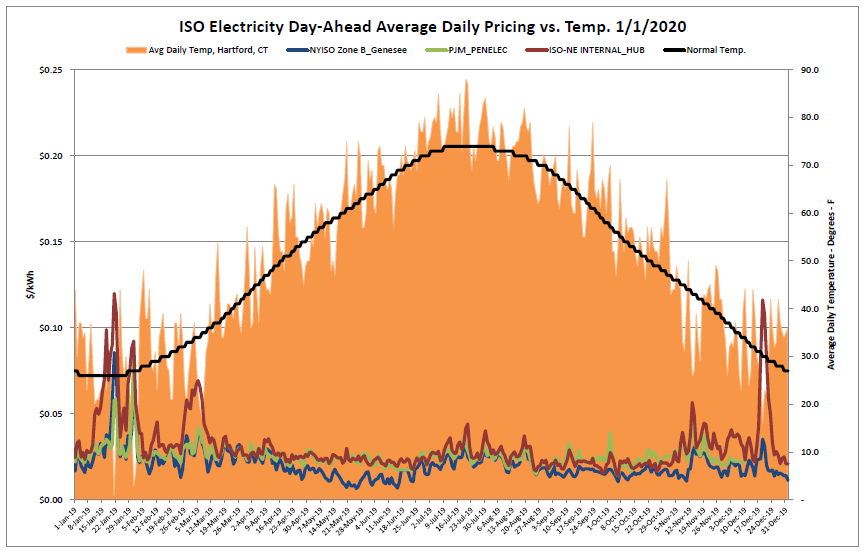
Above-average temperatures resulted in an expectedly quiet week in the daily markets.
Natural Gas Markets
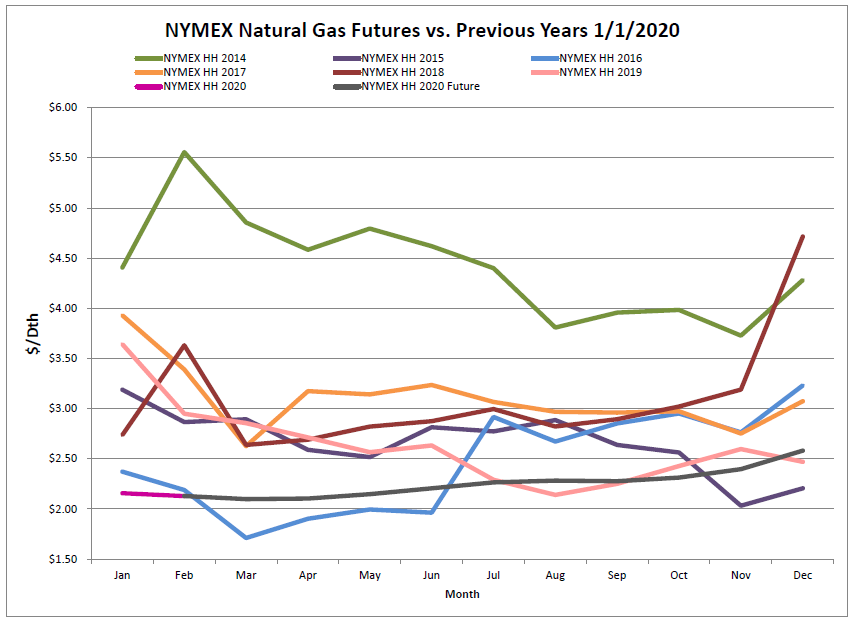
Six-Month Natural Gas Futures
Futures as of 1/1/2020 versus previous week:| Feb-20 | $2.129 | -$0.100 |
| Mar-20 | $2.099 | -$0.081 |
| Apr-20 | $2.104 | -$0.066 |
| May-20 | $2.148 | -$0.061 |
| Jun-20 | $2.206 | -$0.058 |
| Jul-20 | $2.265 | -$0.055 |
Natural Gas Inventory
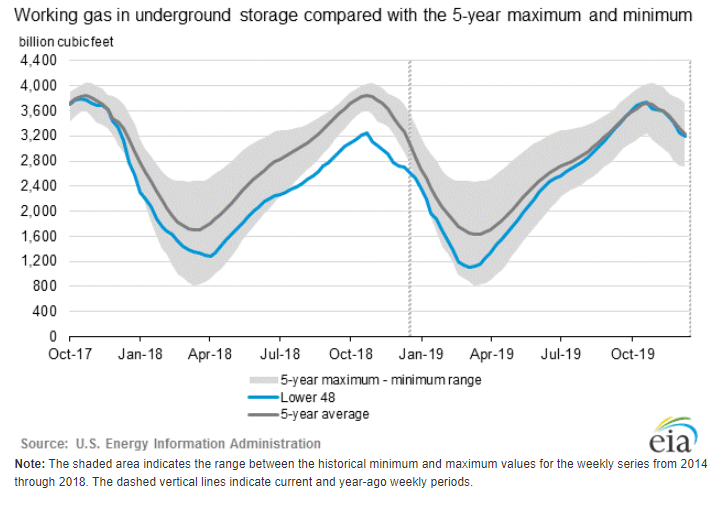
The EIA reported a draw from storage of 58 Bcf. Working gas in storage was 3,192 Bcf as of Friday, December 27, 2019. This was below market expectations which had predicted 67 Bcf; warmer temperatures coupled with the expected decrease in demand over the holiday week led to this steep decline from last week’s 161 Bcf withdrawal.
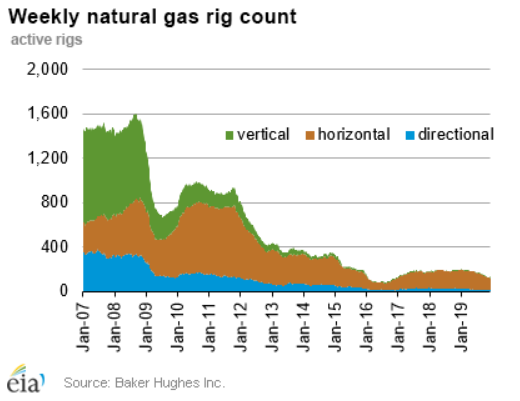 The Baker Hughes exploration gas rig count fell by two this week for a total of 123. This is 75 fewer rigs than the 198 in operation at this time one year ago.
Weather Update
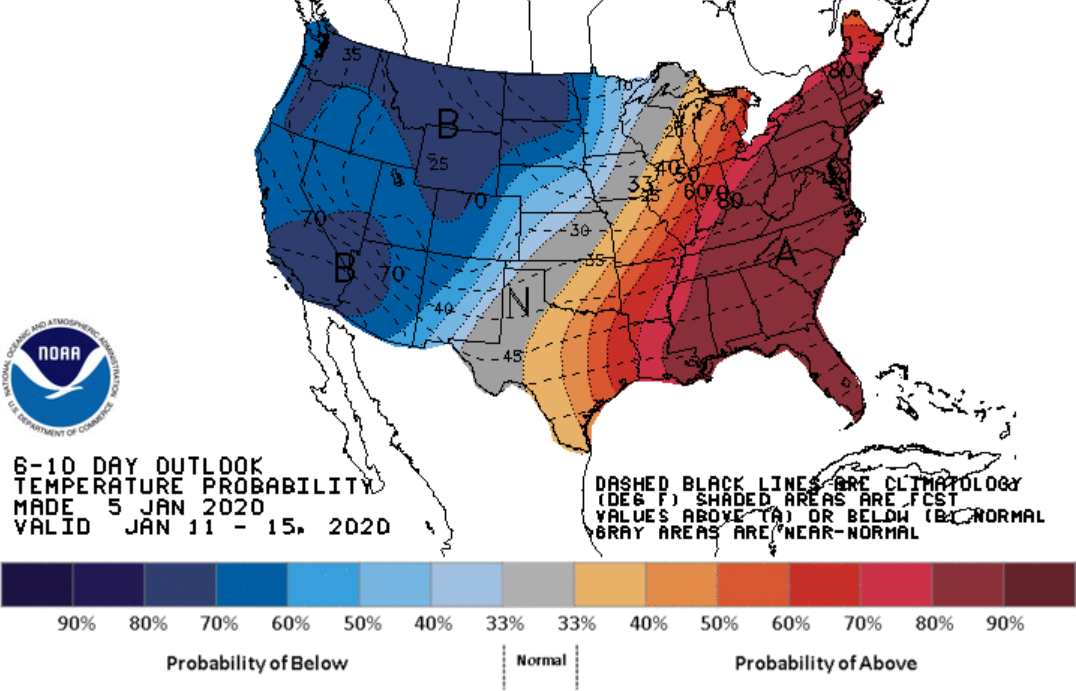
A high probability of below normal temperatures can be expected throughout the western half of the United States while the eastern half, particularly those states along the Atlantic and Gulf coasts, have a high probability of exceeding seasonal norms.